Fatigue
Life Correlations
Coffin-Manson and Morrow's Fatigue
Laws
Hysteresis loops provide useful information for engineering
evaluations of solder joint reliability. For example, the
width of the loop gives an estimate of the inelastic strain
range that solder joints experience. The inelastic strain
range is used in Coffin-Manson type of fatigue laws.
Another, more general approach consists in using the hysteresis
loop area which is a measure of the amount of cyclic strain
energy density that is imparted to solder joints. Strain energy
density is used in Morrow's type of fatigue laws (Morrow,
1964, Ohtani et al., 1985) where cycles to failure are given
as a function of the cyclic inelastic strain energy density,
 Win: Win: |
 |
(25) |
| special definitions: |
| |
C |
material constant |
|
| |
n |
exponent, has been found in the range 0.7 to 1.6
for several
engineering metals, including soft solders |
|
|
Sn-Pb Solder Joint Reliability
Models
Several engineering models have been developed to predict
solder joint reliability based on Coffin-Manson (e.g. Norris-Landzberg,
1969; IPC-SM785) and Morrow's fatigue laws (e.g. Darveaux
et al., 1995; Clech, 1993, 1996). For example, the Darveaux
model uses inelastic strain energy obtained from finite element
analysis to correlate fatigue lives from over 100 experiments.
The Solder Reliability Solutions (SRS) model (Clech, 1996)
derives strain energy densities from simplified, one-dimensional
structural models and correlates failure data from over 60
experiments. |
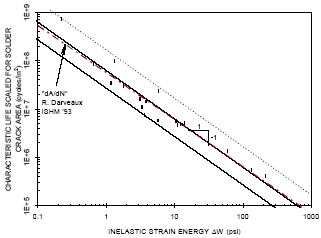 |
Figure
5: SRS correlation of accelerated test data. |
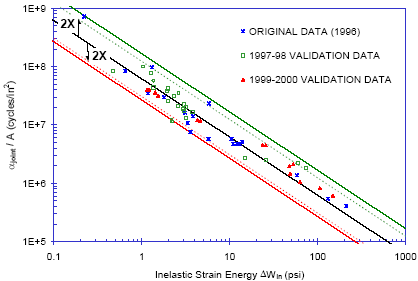 |
Figure 6: Fit of validation data to initial
correlation of solder joint fatigue lives.
Figure 5 shows the SRS correlation of fatigue
life data from nineteen accelerated tests (Clech, 1996).
The correlation gives joint characteristic lives scaled
for the solder crack area, ajoint / A, versus cyclic inelastic
strain energy. The life prediction model based on the best-fit
line going through the data (centerline of correlation band
in Figure 5) was frozen based on 19 experiments. Figure
6 is similar to Figure 5 with 35 data points added in for
model validation (Clech, 2000). Lessons learned from developing
this type of engineering life prediction model, as well
as from Darveaux’s model, are:
-
Given the semi-analytical, semi-empirical
nature of the models, it is important that they be validated
over time when data becomes available for new types of
packages or assemblies.
-
For these models to be more reliable,
the empirical correlation of life data should hold over
several orders of magnitude on both axis, i.e., for inelastic
strain energy (or another damage parameter) and the crack
propagation rate or other life parameter. Note, for example,
that the data plotted in Figures 5 & 6 extends over
three orders of magnitude on the horizontal and vertical
axis.
|
|
SAC vs. SnPb
Fatigue Data
|
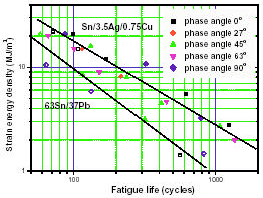 |
Figure 7: SnPb and SAC
fatigue life vs. strain energy correlations (after Park
et al., 2002).
Figure 7 shows correlations of isothermal, mechanical fatigue
lives versus inelastic strain energy for eutectic SnPb and
Sn3.5Ag0.75Cu lap-joint specimens tested at 25°C (data
after Park et al., 2002). This suggests that SAC thermo-mechanical
failure data may correlate to strain energy as in the case
of neareutectic SnPb electronic assemblies. In Figure 7,
the slope of the best-fit line through the 63Sn/37Pb data
is close to –1, similar to the corresponding slopes
in the Darveaux and SRS models for near-eutectic SnPb assemblies.
However, the slope of the line through the Sn3.5Ag0.75Cu
data points in Figure 7 appears to be slightly less than
–1 (i.e. the exponent n in equation (25) would be
greater than 1). This suggests that existing methodologies
for predicting SnPb solder joint lives may apply to SAC
electronic assemblies. However, both the intercept and the
slope of life correlations such as shown in Figures 5 and
6 would have to be adjusted using extensive empirical data.
|
|
