| Figure
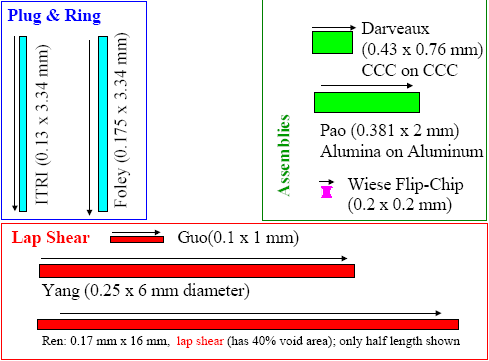
14: Sn-3.5Ag shear joint sizes. Arrows indicate direction
of shear forces.
Isothermal shear testing data was collected from several
sources (first authors quoted in Figure 14). Sizes of the
various joints are shown in Figure 14 with joint dimensions
given as joint thickness and joint length (or diameter) in
shear. The joint depth is not shown and the arrows indicate
the direction of the applied shear forces. Joint thickness
is from 0.1 mm to 0.43 mm and joint length is from 0.2 mm
to 16 mm.
Creep properties are given as a function of an average shear
stress t that is defined as the total shear force divided
by the minimum load bearing area in shear, A, i.e.: t = F
/ A. This is an approximate description of the state of stress
in the solder joints since lap-joint or plug and ring shear
stresses are not distributed uniformly. The shear stress distribution
in the length direction is expected to have maximum values
at the joint ends (where cracks initiate) and follow some
type of hyperbolic sine function. Thus, we expect significant
differences in shear strength values derived, for example,
from the small flip-chip joints and the much longer ring and
plug or the 16 mm long lap shear joints shown in Figure 14.
Moreover, long joints increase the risk of void formation
during soldering of lap shear specimens. This was reported
as being the case in the Ren et al. (1997) experiment where
the void contents was 40% of the load bearing area in shear.
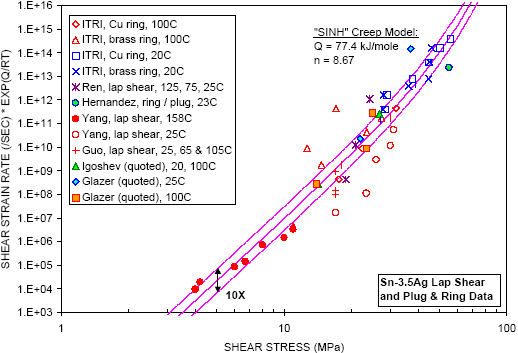
Sn-3.5Ag Lap Joint and Plug &
Ring Shear Data
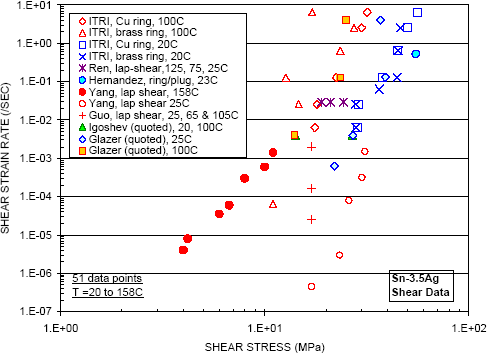
We first look at data for lap shear and plug-and-ring joints
such as shown schematically in Figure 14. The corresponding
creep data was collected from publications by ITRI (No. 656),
Ren et al. (1997), Hernandez et al. (1998), Yang et al. (1995),
Guo et al. (2001), Igoshev et al. (2000) and Glazer (1994-95).
Hernandez used copper ring & plug specimens, and Ren,
Yang and Guo used copper strips for their lap shear specimens.
The raw data is plotted in Figure 15 and is given as temperature,
average shear stress and shear strain rate in Table A.4.
The various datasets show some continuity as well as discrepancies.
For example, the 25°C Glazer data, the 23°C Hernandez
data and the ITRI 20°C datasets appear to follow the same
trendline. However, the 158°C Yang data follows a trendline
that would be below most of the 100°C ITRI data or seems
to line up with the 100°C Glazer data. Note also that,
except for the 158°C data by Yang et al., most of the
data is in the stress range above 10 MPa. As for the tensile
data, the shear data does not cover the less than 10 MPa stress
range that is of interest under service conditions. |