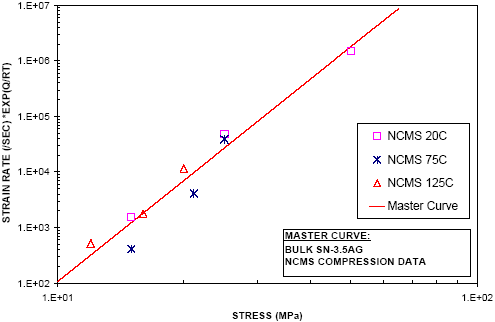
| Figure
13: Sn-3.5Ag compression creep data compared to master
curve of tensile creep data.
Figure 13 shows the NCMS compression creep data compared
to the plot of the master curve for the tensile creep data
(Figure 9). Although the master curve is an approximate fit
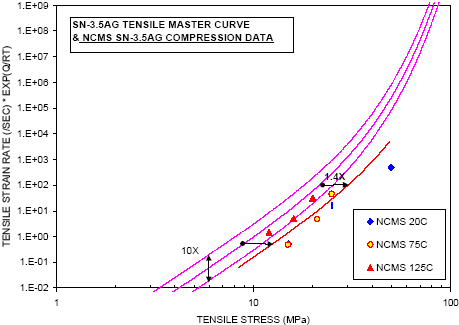
through the tensile data, Figure 13 clearly shows that Sn-3.5Ag
is stronger in compression than in tension. The red curve
in Figure 13 is also an approximate fit through the compressive
data points and is 1.4 times to the right of the centerline
for the tensile data.
Thus, Sn-3.5Ag behaves like an uneven material with higher
strength or more creep resistance in compression than in tension.
It is important to keep this uneven behavior in mind, especially
when conducting finite element analysis. Finite element modeling
of Sn-3.5Ag solder joints should be done with a finite element
code that can handle compressive and tensile creep constitutive
equations separately. |